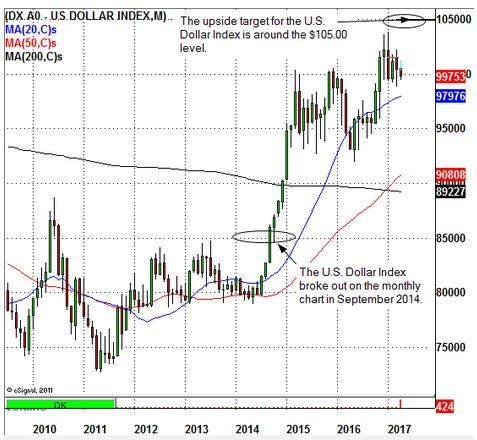
The U.S. Dollar Index has been soaring higher since September 2014. Back then, the Dollar Index traded around $85 per contract. Today, the USD is trading around $99.75 per contract. The talking are calling for a collapse in the U.S. dollar, but that hasn’t happened. In fact, the U.S. Dollar Index has actually strengthened since bottoming in early 2008 when it traded as low as $70.69.
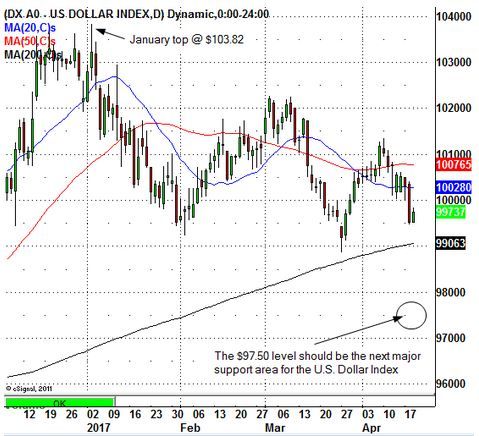
This year, the USD topped out on January 3, 2017 at $103.82. Since that top, the dollar has actually been making lower highs on the daily chart. Lower highs are generally a bearish indication for lower prices, but at some point the U.S. Dollar Index will find a solid institution support level and be defended.
Over the past few weeks, President Trump has voiced his opinion that he likes a weaker USD because it will boost U.S. exports. Since that statement, the U.S. Dollar Index has continued to declined.
According to the current chart pattern, it seems like the U.S. Dollar Index is simply going through a normal correction following a big run in price and time. In the near term, the charts are signaling a decline in the U.S. Dollar Index to the $97.50 level. This area should be where the institutional traders will be waiting to support the USD. The larger time-frame pattern signals a U.S. Dollar Index move all the way up to the $105 level. What could drive that move higher? Perhaps, problems in Europe, Japan and China. Who knows? Which is why I follow the charts, the money flow and chart patterns to determine the trade.
Trade Setup
 When the U.S. Dollar Index declines to the $98-$97 level, it will be the time to buy the Greenback. Traders could play the U.S. dollar on the long side, buying U.S. Dollar Index contracts (DX-M7) or the PowerShares DB US Dollar Index Bullish ETF (NYSE:UUP).


